Software Development Cost: Estimate It With Claude or ChatGPT
Software development cost combines engineering, design, QA and delivery-management days multiplied by their rates, plus ongoing running costs. For the fictional B2B customer portal with Stripe payments and a two-way QuickBooks sync, the method comes to $121,000 to $473,000 without AI and $85,000 to $337,000 with the AI savings pass, depending on the team’s region.
The same customer portal takes 319.2 days of work to build, yet its estimate ranges from $121,000 to $473,000 across regions. The scope stays fixed; the rates change. To judge the cost of software development, you need to see where those days go and which tasks AI can shorten. We’ll follow that portal through Leanware’s estimating method, using three free skills you can run on your own project in Claude or ChatGPT.
If you're a founder, product manager, engineering manager, or business owner who needs a budget before the first vendor call, or who has a quote and can't tell whether it's fair, this is for you. Every rate has a named source and a checked date. The AI savings percentages are Leanware’s planning assumptions rather than measured research results. The customer portal is fictional, and its estimates come from running the published skills.
What Drives Software Development Cost
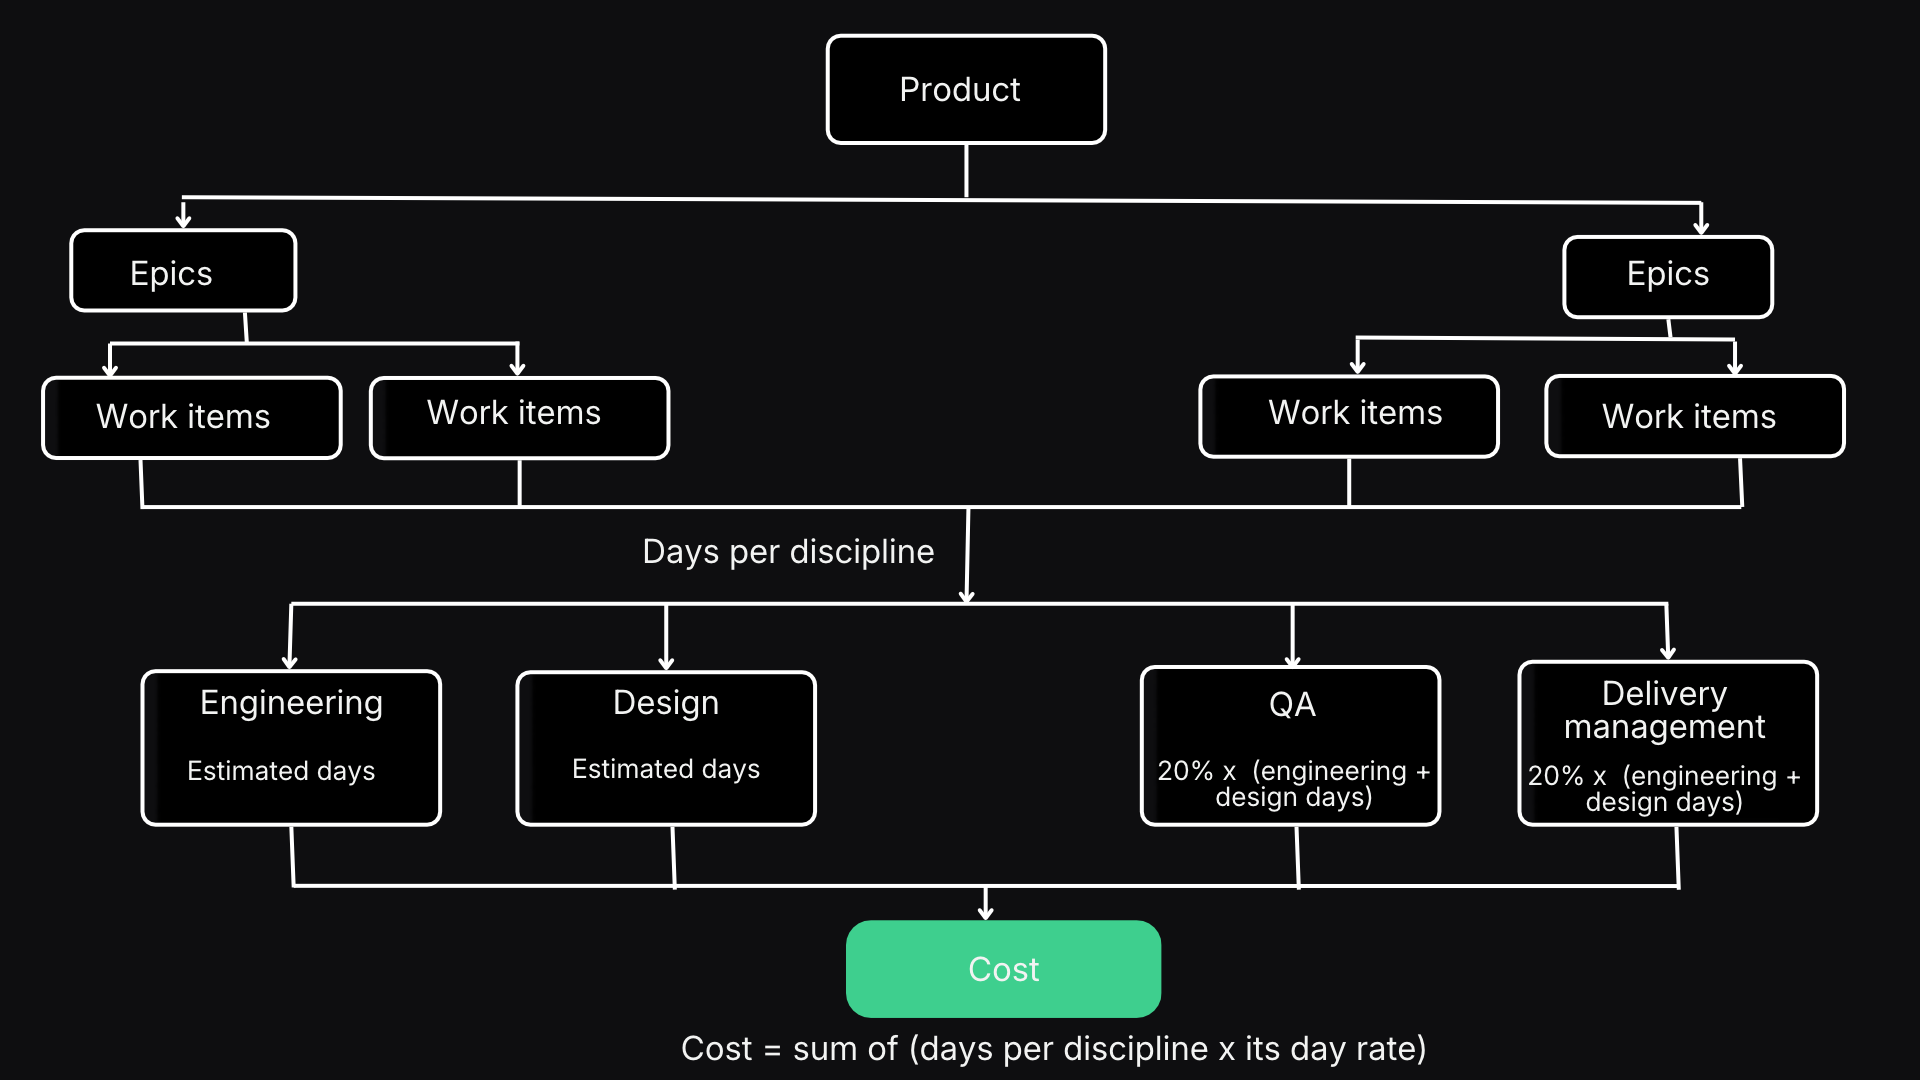
Start with the work, then apply the rates: Build cost = the sum of each work item’s days per discipline x that discipline’s day rate.
The disciplines are engineering, design, quality assurance and delivery management. Six factors change how much effort they require and the cost to develop software.
Scope determines how many roles, screens and workflows the team must build. A portal where customers view invoices needs less work than one where buyers place orders, managers approve them, and staff resolve disputes.
Integrations add effort wherever systems exchange data. A straightforward connection to a documented API such as Stripe may take days; understanding an undocumented legacy system can take weeks.
Data and compliance requirements affect the whole product. Access controls, audit logs and rules for handling customer information touch multiple workflows.
Platforms determine how many experiences you need to build and test. A responsive website and separate iOS and Android applications create different workloads.
AI features add uncertainty. Prompts, retrieval, evaluations and guardrails need testing against real examples, while standard create, read, update and delete functions usually have clearer pass criteria.
Unclear requirements increase uncertainty. Sync with accounting isn't enough to estimate until someone identifies the records, their direction of travel, and what happens when they disagree.
Rates vary by country, seniority, and whether you hire an employee, freelancer, or firm. Software development costs continue after launch through hosting, support and further improvements. Leanware’s published support retainer starts from $1,682 a month for 42 hours of engineering time.
How to Estimate Software Development Cost From First Principles
To estimate software development cost, start with requirements you can break into work someone can demo. This bottom-up estimate makes software development cost estimation easier to inspect because each cost has a corresponding task.
- Start with what the software must do. Put aside any suggested budget until you complete the estimate. Use a requirements document or a description of users, workflows, integrations and constraints. Identify what already exists and what the team must create.
- Break the scope into small, demonstrable work items. Group them by phase and epic. Connect each item to its requirement. An epic is a large piece of functionality, such as ordering or account management. If one item exceeds 3 weeks of engineering, split it into smaller pieces that can be reviewed separately.
- Estimate engineering and design days separately. A database migration may need engineering without interface design. An ordering screen needs both. Estimate from a senior engineer’s perspective and round up where uncertainty remains, recording the assumptions that caused it.
- Calculate QA and delivery-management effort. Leanware’s default assigns 20% of engineering plus design to QA and another 20% to delivery management. Testing and coordination grow with the work, so the estimate derives these allowances from the build rather than guessing them independently.
- Put risk allowances inside the risky items. An integration that needs investigation should carry that effort in its own estimate. Do the same for AI features, compliance-heavy modules and undocumented systems. A separate contingency line hides where the uncertainty sits and is easier to remove without resolving the risk.
- Check whether the team has enough capacity. Divide each discipline’s effort by the people available and their working capacity over the proposed timeline. Account for part-time roles. If the designer needs more time than the schedule allows, the plan has a staffing or sequencing problem even if the total budget looks reasonable.
- Apply the rates and show a range. Convert hourly rates into day rates using the working hours per day, then multiply each discipline’s days by its rate. Keep a low-to-high range until the requirements and delivery conditions are settled.
Other software cost estimation methods can also be useful. Three-point estimation, for example, makes uncertainty clear instead of relying on one likely outcome.
Method | How it works | When it fits | Typical use |
|---|---|---|---|
Analogous | Starts with the cost of similar completed projects. | Relevant historical projects exist. | Early budget conversations. |
Parametric | Uses relationships between size and effort, such as COCOMO or function points. | Reliable size measures and calibration data exist. | Repeatable estimates across comparable work. |
Three-point / PERT | Uses optimistic, likely and pessimistic estimates for each item. | Task uncertainty needs to be visible. | Comparing possible outcomes. |
Bottom-up | Estimates individual work items and adds them together. | Requirements are detailed enough to break down. | A proposal whose assumptions can be inspected. |
Team-based | Multiplies team size by months and rates. | Staffing and duration are reasonably clear. | Cross-checking the bottom-up total. |
Bottom-up estimating takes the most preparation, but when requirements exist, it is the most defensible, because every cost traces back to a work item. The other methods help test whether its result is plausible.
Market Rates by Country: The Other Half of the Formula
Developer rates by country are the multiplier applied to the work. Software development rates also depend on the role, seniority and purchasing arrangement.
A billed rate is what a firm or freelancer charges. A salary is what an employee earns before the employer’s additional costs for benefits, taxes, equipment and management. Comparing them directly understates the cost of employing someone.
A lower hourly rate also does not guarantee a lower project cost. If the work takes more days, the cheaper rate can produce a larger bill.
The market-rates skill produced these rates for the customer portal example, with one row per role and region. Every range represents hourly rates billed by firms.
Role | Region | Low (USD/Hour) | High (USD/Hour) | Source | Checked |
|---|---|---|---|---|---|
Senior software engineer | United States | $137 | $192 | GSA CALC+ ceiling rates, 25th to 75th percentile. | November 2026 |
Senior software engineer | Latin America | $60 | $75 | November 2026 | |
Senior software engineer | Eastern Europe | $55 | $86 | Accelerance 2026 outsourcing rate trends; Accelerance rates guide, as reproduced by DistantJob. | November 2026 |
UI/UX designer (mid-senior) | United States | $100 | $179 | GSA CALC+ ceiling rates, 25th to 75th percentile; Clutch UX/UI Design Pricing Guide 2026. | November 2026 |
UI/UX designer (mid-senior) | Latin America (Mexico) | $25 | $49 | November 2026 | |
UI/UX designer (mid-senior) | Eastern Europe (Poland, Ukraine) | $25 | $99 | November 2026 | |
QA engineer (mid) | United States | $86 | $140 | GSA CALC+ ceiling rates, 25th to 75th percentile. | November 2026 |
QA engineer (mid) | Latin America | $40 | $60 | Accelerance rates guide, as reproduced by DistantJob. | November 2026 |
QA engineer (mid) | Eastern Europe | $35 | $66 | Accelerance rates guide, as reproduced by DistantJob. | November 2026 |
Project manager (senior) | United States | $152 | $207 | GSA CALC+ ceiling rates, 25th to 75th percentile. | November 2026 |
Project manager (senior) | Latin America | $53 | $75 | Accelerance rates guide, as reproduced by DistantJob. | November 2026 |
Project manager (senior) | Eastern Europe | $50 | $87 | Accelerance rates guide, as reproduced by DistantJob. | November 2026 |
The example team has two senior engineers, a half-time designer, a half-time QA engineer, and a half-time project manager. Its blended hourly rate is $127 to $185 in the United States, $51 to $69 in Latin America and $47 to $85 in Eastern Europe.
The US government figures are ceiling rates, meaning not-to-exceed prices rather than evidence of what every commercial buyer pays. Calculations use the 25th to 75th percentiles of the GSA dataset checked on November 3, 2026. Some Accelerance figures came from a secondary reproduction because the original tables are gated. Clutch’s designer figures describe agency rates by country, with Mexico representing Latin America.
For more country detail, see the guide to rates by country in Latin America. For reference, Leanware’s dedicated teams start from about $6,000 a month for one full-time engineer.
How Much AI Saves, Task by Task
Research shows that AI saves the most time when tests, compilers or validators can check its output. Savings are smaller when work needs human judgment or client approval. Team-level gains are smaller than gains on individual tasks because review, QA, and decisions don't speed up equally. Software development cost with AI, therefore, depends on the activities within each task.
Research on AI developer productivity shows why a single discount would be misleading. A February 2023 controlled study found that developers using GitHub Copilot completed a defined JavaScript task 55.8% faster. A June 2025 study combining field experiments at Microsoft, Accenture and a Fortune 100 company found 26.08% more completed tasks, with larger gains among less-experienced developers. Those outcomes measure different things and should not be treated as equivalent budget reductions.
METR’s July 2025 randomized study found the opposite result in another setting: experienced developers working on familiar, mature repositories took 19% longer with AI tools. A short coding task and a change to an established product place different demands on context, review and verification. Faster code generation alone does not establish faster delivery.
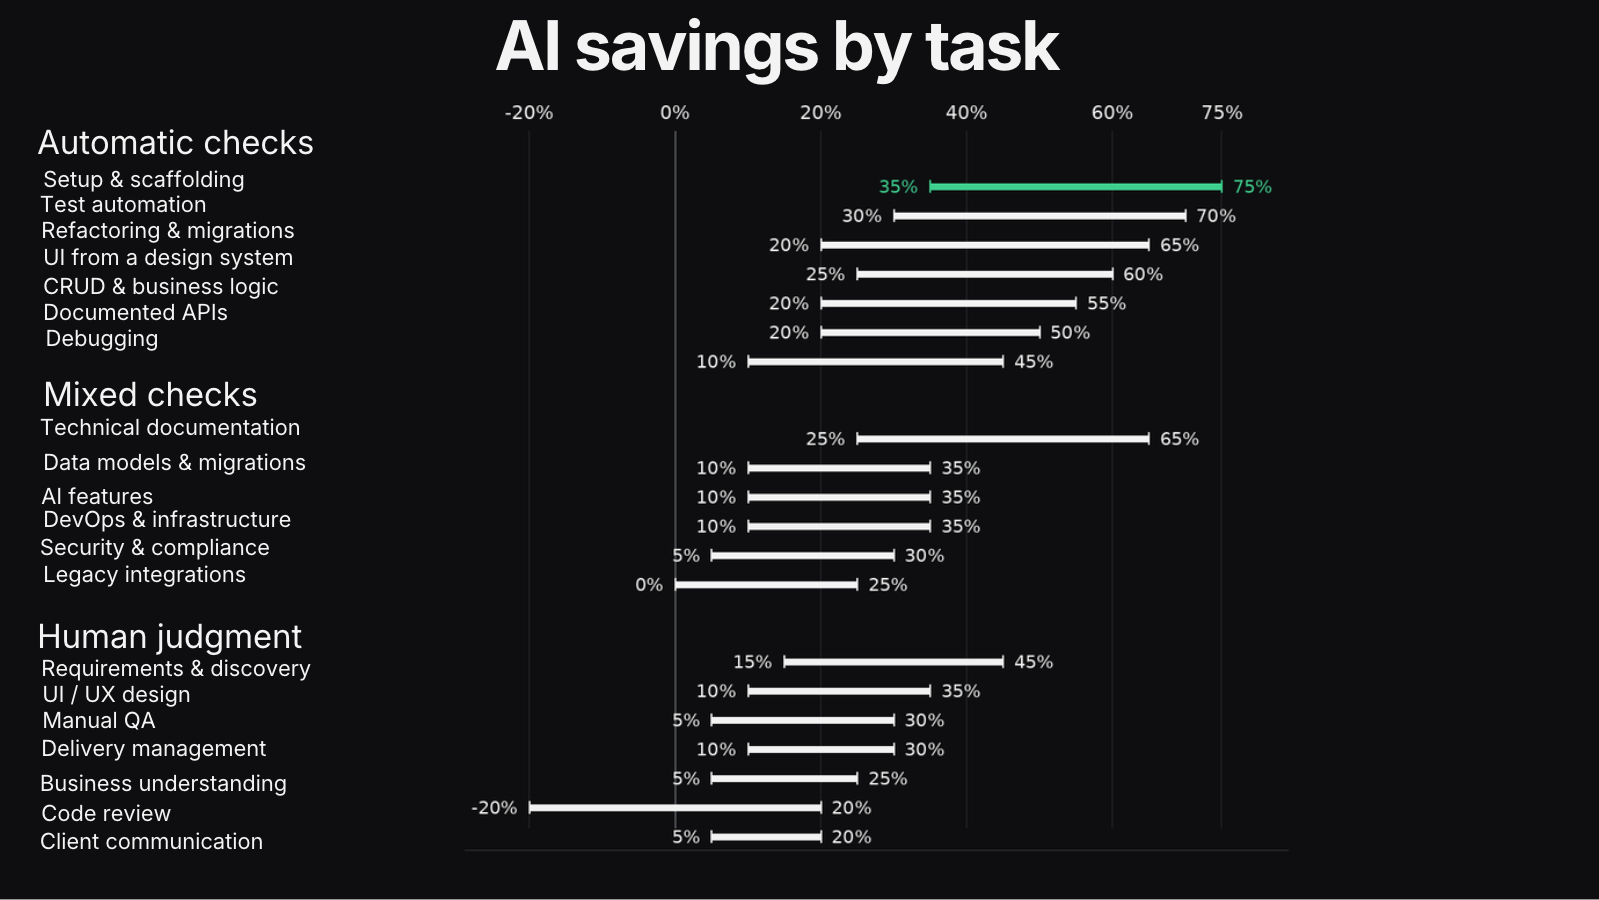
The table below contains Leanware’s October 2026 planning assumptions for a senior team using agentic coding tools daily. These are not measured study results or guaranteed savings. Typical teams in the studies above save less. The skill starts with an aggressive figure and reduces it toward the floor when the work is harder to hand to AI.
Activity | Aggressive saving (applied) | Floor (item hard to hand to AI) | What AI does not save |
|---|---|---|---|
Project setup, scaffolding and CI/CD bootstrap | 75% | 35% | Stack and repo-layout decisions, house conventions, cloud accounts and secrets, approving the production pipeline |
CRUD screens and standard business logic | 55% | 20% | Settling ambiguous business rules and edge cases, permission and data-integrity decisions, client acceptance |
UI built from an existing design system | 60% | 25% | Visual QA across browsers and screen sizes, accessibility review, interaction polish, fidelity to design intent |
Integrations with documented APIs | 50% | 20% | Sandbox and credential access, auth flows, webhook ordering and idempotency, vendor quirks, reconciliation edge cases |
Integrations with legacy or undocumented systems | 25% | 0% | Discovering undocumented behavior, test-environment access, knowledge held by client staff, side effects on systems of record |
Data modeling and database migrations | 35% | 10% | Normalization, tenancy and ownership decisions, backfill and rollback strategy, live-data safety |
AI features (retrieval, prompts, evaluations, guardrails) | 35% | 10% | Defining success criteria, reading real outputs, labeling, re-running evaluations on every model or prompt change, safety sign-off |
Debugging and bug fixing | 45% | 10% | Reproducing the bug, production access and logs, root-cause judgment across systems, proving no regression |
Refactoring and large mechanical migrations | 65% | 20% | Choosing the target design, building the validation harness, the long tail of edge cases, rollout and equivalence sign-off |
Automated test generation and test automation | 70% | 30% | Deciding which behavior matters and what correct looks like, flaky-test triage, test data and environments, owning the suite |
Manual and exploratory QA | 30% | 5% | Noticing what feels wrong, usability, unspecified behavior, go or no-go decisions, checking AI-written test cases are real |
Code documentation and technical writing | 65% | 25% | Deciding what to document and for whom, rationale that is not in the code, factual accuracy, editorial review |
Code review | 20% | -20% (can take longer) | Judging design fit and whether the change should exist, business context, approval accountability; AI produces more and larger changes to review |
Security and compliance | 30% | 5% | Risk judgment, proving a patch keeps behavior intact, attack chains in business logic, security review of AI-written code, attestation |
DevOps and infrastructure | 35% | 10% | Network and permission design, production change approval and rollback, environment failures outside the model's view |
UI/UX design | 35% | 10% | Research with real users, design judgment, production visual polish, design review |
Requirements and discovery | 45% | 15% | Getting the truth from real stakeholders, prioritization trade-offs, sign-off |
Business domain understanding | 25% | 5% | Unwritten rules, exceptions and politics, why a process exists, who actually decides |
Delivery and project management | 30% | 10% | Coordination and unblocking, sequencing and escalation decisions, risk judgment |
Client communication and stakeholder management | 20% | 5% | Live conversations, scope and price negotiation, expectation-setting, trust |
The skill splits each task into smaller activities, then checks nine factors to estimate how much time AI could save. Whether the output can be checked automatically carries the most weight, followed by specification clarity, unwritten knowledge, codebase familiarity and complexity. Context size, language and API familiarity, task length and stakes also matter. Additional caps reduce savings for sensitive work, unfamiliar codebases and oversized changes. The full scoring instructions accompany the skill.
Code review and QA remain priced against effort required without AI. The skill also adds back 10% of the days saved on coding as a reserve for additional review, testing and fixes.
AI savings depend on how easily the work can be checked. Drafting user stories saves about as much time as scaffolding, while integrating an undocumented legacy system saves almost none.
The skill splits some rows further. Mechanical test migrations can save up to 90%, while live client conversations save close to 0%.
Leanware reviews its assumptions every six months because capabilities are advancing quickly: METR’s time-horizon research found that the length of tasks AI could complete at 50% reliability doubled roughly every four months in its post-2023 data, while measured workplace productivity gains remain slower and uneven.
Run the Method With Claude or ChatGPT: Three Free Skills
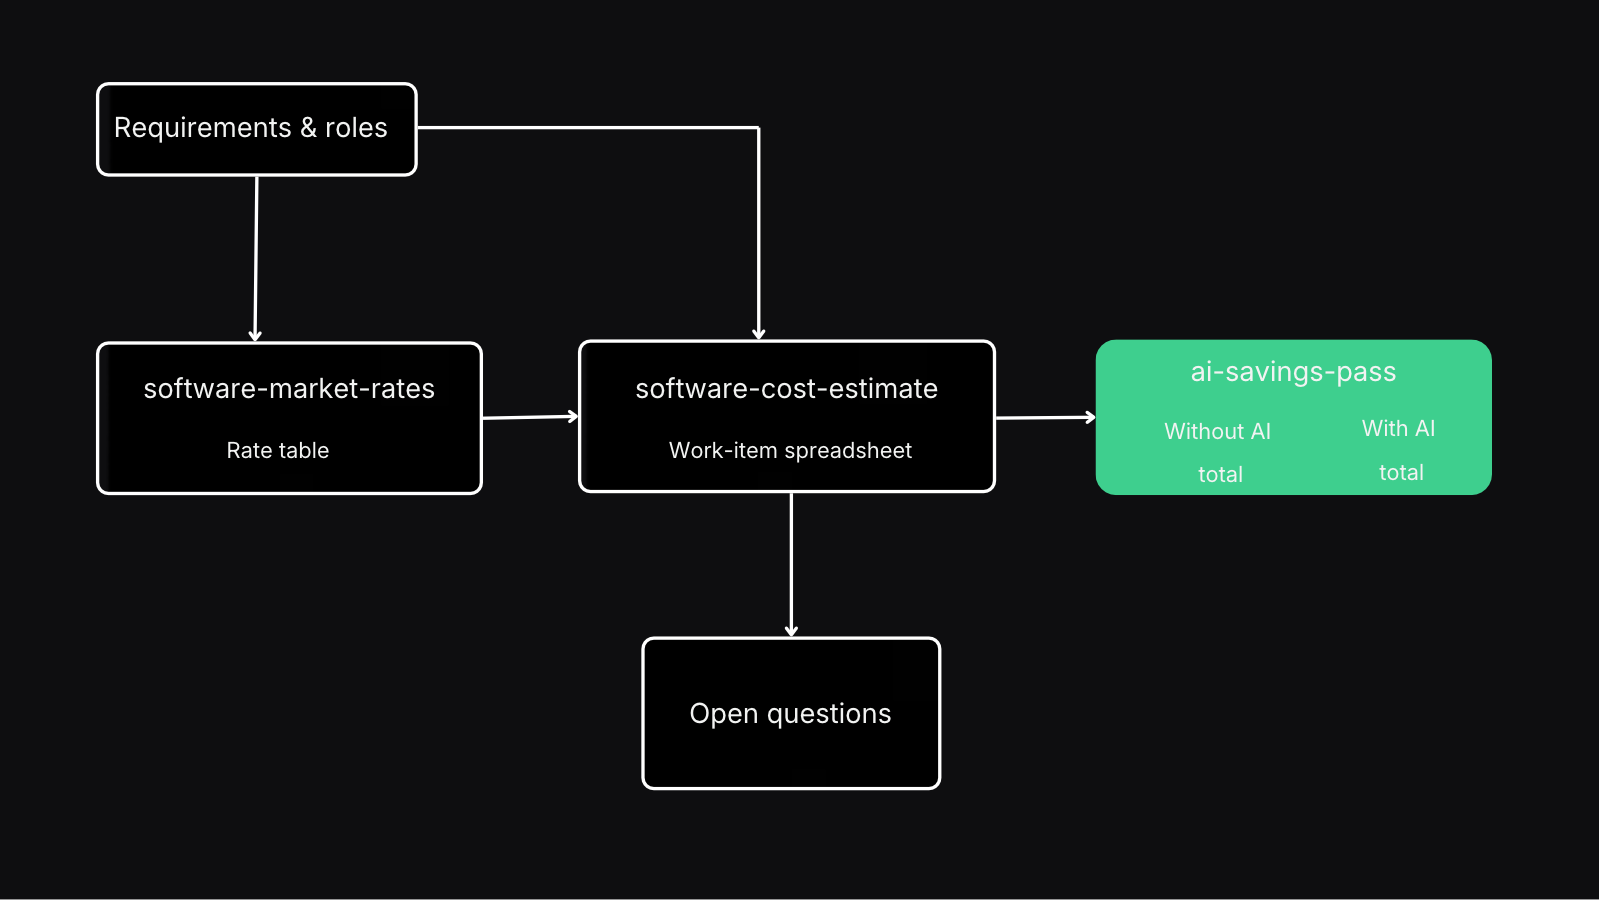
Claude skills are instructions and supporting resources that Claude loads when a task needs them. These three skills carry the estimating method from sourced rates through a work-item spreadsheet to a comparison with and without AI.
In Claude Code, run these commands.
/plugin marketplace add Leanware-io/software-estimation-skills
/plugin install software-market-rates@software-estimation-skills
/plugin install software-cost-estimate@software-estimation-skills
/plugin install ai-savings-pass@software-estimation-skills
For Claude.ai and the Claude desktop app, download the three ZIP files and upload each through Settings > Capabilities > Skills. Enable code execution and file creation so the skills can produce spreadsheets.
For ChatGPT, follow OpenAI’s instructions for using skills in ChatGPT. Alternatively, paste the chaining prompt below to run the method without installing the skills.
software-market-rates skill
This skill researches billed rates by role, seniority and country, attaching a source and checked month to each number. It separates salaries from billed rates and leaves unsupported cells empty.
Inputs: Required roles, seniority, regions and whether you are comparing firms, freelancers or employees.
Outputs: A sourced rate table and a blended rate for the proposed team.
software-cost-estimate skill
The first-principles estimate skill breaks requirements into work items and estimates engineering and design days. It derives QA and delivery-management effort, checks capacity and calculates the cost range.
Inputs: Requirements, platforms, integrations, compliance needs and rates from the first skill or your own sources.
Outputs: A spreadsheet containing work items, effort, item-level risk allowances, capacity, regional costs and open questions.
ai-savings-pass skill
This skill evaluates how much of each work item you can hand off to AI. It applies the activity savings, scoring rules, caps and downstream reserve, then compares the estimate with and without AI.
Inputs: The estimate spreadsheet and a description of how the team uses AI.
Outputs: Adjusted effort and costs, the caps applied, items receiving little discount and conditions that could improve their savings.
To run any of the three skills, name it in your message and attach the inputs it needs.
The following prompt chains all three steps. Replace the bracketed project details with your own.
Chaining Prompt
Estimate what this custom software will cost to build, in three steps. Show the output of each step before starting the next. If the skills software-market-rates, software-cost-estimate and ai-savings-pass are available, use them for steps 1, 2 and 3; otherwise follow the instructions below.

MY PROJECT
What it must do: [who uses it (user roles), the main workflows, each integration and whether it has a documented API, the platforms (web, iOS, Android), compliance needs, anything already built]
Rate regions to compare: [for example United States, Latin America, Eastern Europe]
Team and timeline: [for example 2 senior engineers, a part-time designer, 1 QA engineer, a part-time project manager, 4 months]
How the team uses AI: [for example senior engineers use agentic coding tools such as Claude Code every day]

STEP 1. MARKET RATES
Research billed hourly rates from firms for each role and seniority in each region. Every number needs a named source, a link and the month you checked it; leave a cell empty rather than guess. Keep billed rates, salaries and loaded employee cost apart. Output a table (role, seniority, region, low, high, source, month) and a blended rate per region for the team above.

STEP 2. FIRST-PRINCIPLES ESTIMATE
Ignore any budget I mentioned. Restate the scope as numbered requirements. Break the work into atomic, demoable work items grouped by phase and epic, none over 15 days of engineering, including setup and CI/CD, the data model, integration testing, release hardening and a round of feedback rework. Estimate engineering days and design days per item as a senior engineer would, rounding up when unsure. Derive QA and project management at 20% each of engineering plus design. Put the risk buffer inside the risky items (integrations, AI features, compliance, undocumented systems), never as a separate line. Check capacity: days per discipline divided by the people available, against the timeline. Cost = days x 8 hours x each discipline's hourly rate, for every region, as a low-to-high range. Cross-check against people x months x 21 working days x 8 hours x rates. List the open questions that would change the number. If you can create files, also give me a spreadsheet.

STEP 3. AI SAVINGS PASS
Split each work item into its activities. Each activity saves between a floor and an aggressive figure (planning figures for a senior team that uses agentic coding tools daily, dated October 2026): setup and CI/CD 35% to 75%; CRUD and business logic 20% to 55%; UI from a design system 25% to 60%; documented-API integrations 20% to 50%; legacy or undocumented integrations 0% to 25%; data modeling and migrations 10% to 35%; AI features 10% to 35%; debugging 10% to 45%; refactoring and mechanical migrations 20% to 65%; test automation 30% to 70%; manual QA 5% to 30%; documentation 25% to 65%; code review -20% to 20%; security and compliance 5% to 30%; DevOps 10% to 35%; UI/UX design 10% to 35%; requirements and discovery 15% to 45%; domain understanding 5% to 25%; project management 10% to 30%; client communication 5% to 20%.

Score each activity 0, 1 or 2 (2 favors AI) on verifiability (weight 3), spec clarity, tacit knowledge, codebase state and complexity (weight 2 each), context size, language and API popularity, task length and stakes (weight 1 each). D = weighted sum / 30. Saving = floor + (aggressive - floor) x D. With no automatic check and high stakes, use the floor. Subtract 5 points for high-stakes work (authentication, payments, personal data, compliance or irreversible changes; 10 if the AI writes that code), 5 for an unfamiliar codebase without agent-ready docs, and 5 for a large unsliced AI change. Build work never goes below 0%; flag it as a slowdown risk when D is under 0.25. Price code review and QA on the days without AI. Add back 10% of the days saved on code-producing work as a reserve for the extra review, QA and fixes. Show each region's cost without AI and with AI, the items you barely discounted and what would move them up, and keep hours freed separate from calendar time.

Finish with the cost range, what drives it most, and the open questions I should take to a vendor.
The skills structure the estimate around the information you provide. They cannot discover a business rule you have not described or confirm an integration they cannot inspect. Review the assumptions as a senior engineer would, and take the open questions to the vendor before treating the result as a commitment.
You can inspect the instructions and supporting files in the source on GitHub.
Worked Example: Estimating a Custom Customer Portal
Custom software development cost is more useful when tied to a well-defined project. This fictional example is a customer portal for a B2B distributor, with customer logins and roles, order history, one-click reorder, Stripe card payments, a two-way QuickBooks Online sync and an administrative back office.
The product is a responsive web application, with no native mobile app. Leanware ran the three skills on that scope. The tables below are the skills’ output for that scope.
Skill output: work items rolled up by epic, in days.
The estimate contains 46 work items. QA and delivery management each equal 20% of engineering plus design, and a day is 8 working hours.
Epic | Engineering | UI/UX design | QA | Delivery mgmt | Total days |
|---|---|---|---|---|---|
Discovery and design | 10 | 13 | 4.6 | 4.6 | 32.2 |
Foundations | 17 | 1 | 3.6 | 3.6 | 25.2 |
Accounts, roles and approvals | 24 | 6 | 6 | 6 | 42 |
Ordering and reorder | 21 | 8.5 | 5.9 | 5.9 | 41.3 |
Invoices and Stripe payments | 12 | 3 | 3 | 3 | 21 |
QuickBooks Online sync | 53 | 2 | 11 | 11 | 77 |
Staff back office | 16 | 5.5 | 4.3 | 4.3 | 30.1 |
Quality and launch | 33 | 3 | 7.2 | 7.2 | 50.4 |
Total | 186 | 42 | 45.6 | 45.6 | 319.2 |
How much does custom software development cost for this scope? Applying the regional rates from Table 2 gives these ranges. These estimates cover the build; running costs and vendor quotes require separate assessment.
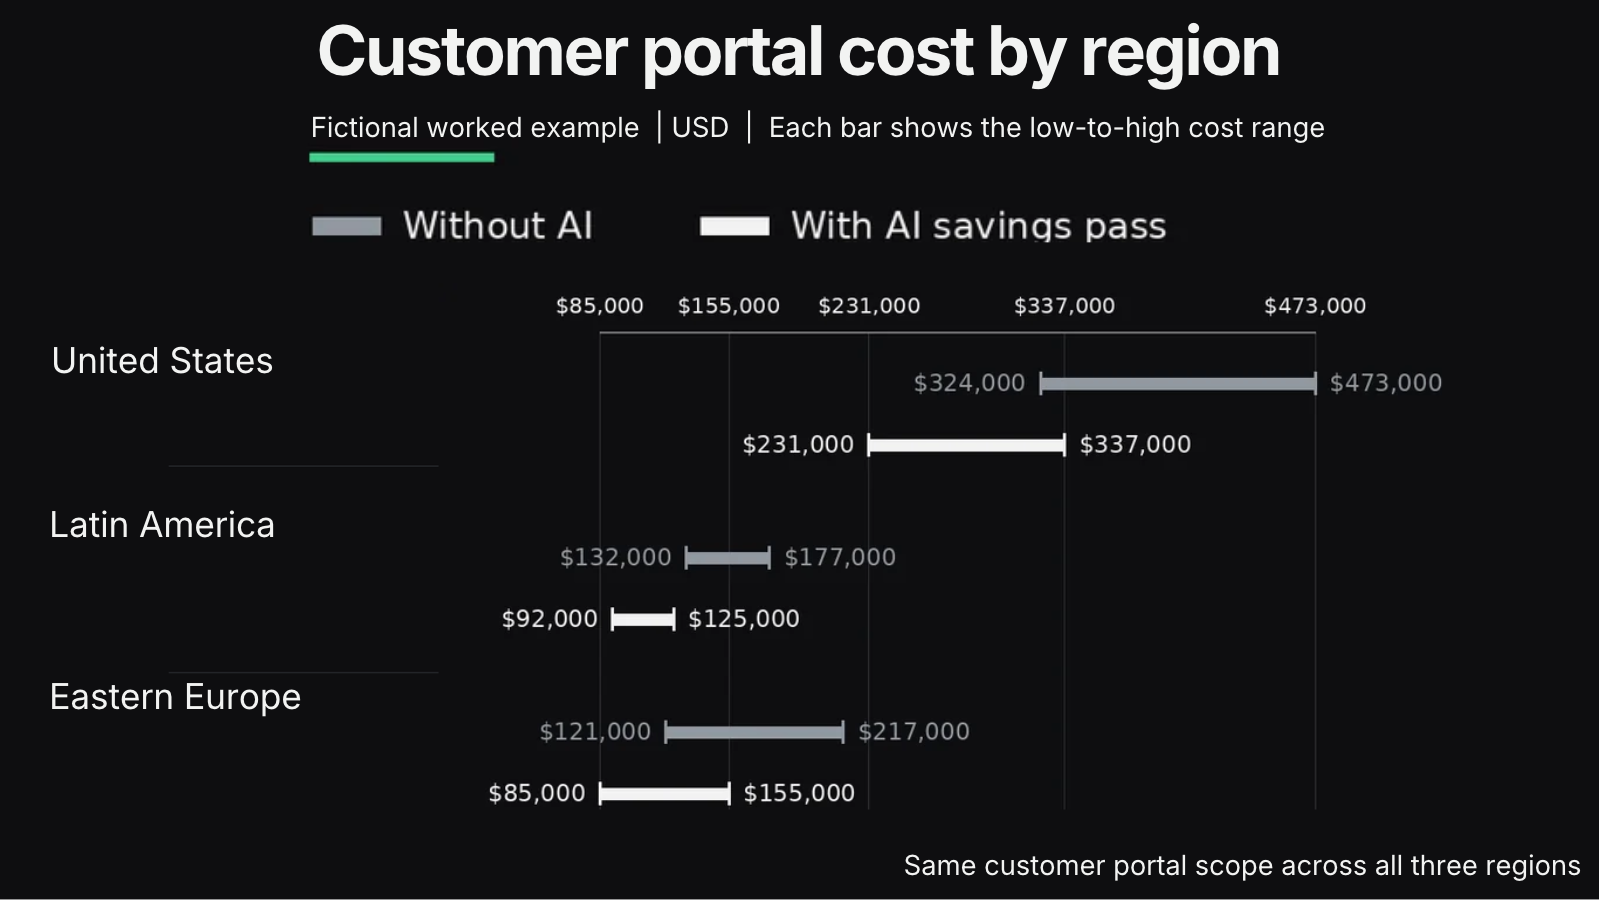
Skill output: cost by rate region, without AI and with the AI savings pass.
Rate region | Without AI | With the AI savings pass |
|---|---|---|
United States | $324,000 to $473,000 | $231,000 to $337,000 |
Latin America | $132,000 to $177,000 | $92,000 to $125,000 |
Eastern Europe | $121,000 to $217,000 | $85,000 to $155,000 |
The QuickBooks Online sync is the largest epic at 77 of 319.2 days, or 24%. It includes connection and token management, mapping customers and products, moving orders and payments between systems, resolving conflicts and reconciling records. Quality and launch follow at 50.4 days, then accounts, roles and approvals at 42 days; their risk allowances are included in those items.
The AI pass reduces total effort to 225.8 days, a 29% saving after adding a 7.5-day reserve for downstream review, QA and fixes. The largest task savings are in repository and CI/CD setup (50%), the UI component library (41%), and the payments view (41%).
Smaller savings appear in architecture and data-model design (16%), the QuickBooks technical spike and data audit (21%), post-launch hypercare (22%), and visual design and production cutover (23%). Code review becomes slightly slower on several items because there is more generated code to inspect.
Capacity also matters. With two senior engineers, a half-time designer, a half-time QA engineer, and a half-time project manager, the proposed four-month plan exceeds available capacity. Engineering needs 4.4 months, or 111%. QA and delivery management each need 4.3 months, or 109% of the planned capacity. The AI pass reduces engineering effort to 3.0 months, but customer feedback, approvals and account access still affect elapsed time.
Skill output: open questions to take to a vendor.
- How does the distributor hold customer-specific prices: QuickBooks price rules, a single list price, or a spreadsheet?
- Does QuickBooks hold one customer per company, or sub-customers per site or buyer, and how many duplicates exist?
- Which side owns which fields (for example, can staff edit a portal-created invoice in QuickBooks), and who resolves conflicts?
- How should Stripe payments and fees be booked in QuickBooks (undeposited funds or a clearing account, fee expense, payout reconciliation), and are partial payments or card surcharges allowed?
- Does the distributor use QuickBooks automated sales tax, and do customers have exemptions?
- Where does stock come from (QuickBooks inventory quantities, a warehouse system, or not tracked)?
- Is one approval limit per company enough, or are per-user limits, multi-level approvals or budgets needed?
- Do new orders need a full catalog with search, or is reorder plus quick add by item code enough at launch?
The worked-example outputs include raw results and both spreadsheets. Use them to inspect the assumptions; another portal’s custom software cost will depend on its own scope.
From an Estimate to a Number Someone Commits To
Estimates usually become unreliable when requirements remain unwritten, risky items are treated as routine work, or the estimator is not accountable for delivery. A detailed spreadsheet helps expose those problems, but it cannot resolve them without a decision.
The 40/20/40 rule describes a 40% planning and design split, 20% coding and 40% testing. Treat it as a flexible rule of thumb. AI can reduce coding effort without reducing review and testing in the same proportion, so a team should estimate those activities separately.
AACE International’s estimate classes run from Class 5, with the least-defined scope, to Class 1, with the most-developed scope. They describe how mature the estimate’s inputs are. AACE explicitly cautions that a class does not determine a fixed accuracy range: uncertainty must be assessed for the particular project.
Recommended Practice 18R-97 gives these indicative accuracy ranges (low end, then high end): Class 5, a rough order of magnitude, -20% to -50% and +30% to +100%; Class 4, -15% to -30% and +20% to +50%; Class 3, -10% to -20% and +10% to +30%; Class 2, -5% to -15% and +5% to +20%; Class 1, a definitive estimate, -3% to -10% and +3% to +15%. The ranges come from process-industry projects and do not guarantee the accuracy of a software estimate.
The next step toward a committed number is a discovery phase that resolves scope and prices deliverables. Leanware’s Sprint 0 has a fixed fee of $5,000 to $15,000 and takes two to four weeks. It produces epics and user stories with acceptance criteria, alongside a billable milestone plan with every milestone defined and priced.
If you've already built a working app with AI tools, a code audit can identify what remains before the business can rely on it. The next decision is the pricing model that fits the defined work and its remaining uncertainty.
Final Thoughts
List the work, estimate days by discipline, apply sourced rates and adjust individual AI activities while keeping open questions visible. Skills provide a first number; Sprint 0 turns a defined scope into priced milestones. If you want to check your assumptions, tell us what you are building, what it must connect to and which parts remain uncertain.
Frequently Asked Questions
How much does software development cost?
For a fictional B2B customer portal, estimated development costs range from $121,000 to $473,000 without AI and $85,000 to $337,000 with the AI savings pass, depending on the team’s region. The estimate adds up days per discipline multiplied by each discipline’s day rate. Your project’s scope changes the effort and cost. Hosting, maintenance, and ongoing support add running costs after launch.
How do you calculate the cost of software development?
Break requirements into work items, estimate engineering and design days, and calculate the time needed for QA and delivery management. Include risk buffers within uncertain tasks, check team capacity, then multiply each discipline’s days by its day rate. Present the result as a range.
How much does custom software development cost?
For the fictional customer portal in this guide, a US team costs $324,000 to $473,000 without AI and $231,000 to $337,000 with the AI savings pass. In Latin America, $132,000 to $177,000 without AI and $92,000 to $125,000 with AI. In Eastern Europe, costs range from $121,000 to $217,000 without AI and $85,000 to $155,000 with the AI savings pass. Your own scope will move these numbers more than anything else.
Does AI reduce software development cost?
AI reduces costs when you can automatically check its output. Leanware’s planning assumptions put scaffolding savings at 35%-75%, compared with 5%-20% for client communication. Code review and QA remain budgeted against the original build effort. Judgment-heavy work, such as client communication and code review, offers smaller savings.
How much does it cost to build an app with AI?
Cost depends on whether you build it yourself with AI or hire a team that uses AI tools. Building it yourself still requires production checks and support; a team estimates savings task by task. See app development cost for app-specific ranges.
How much does it cost to hire a software developer?
The source table lists senior engineers at $137-$192 an hour in the US, $60-$75 in Latin America and $55-$86 in Eastern Europe. These rates show what firms charge rather than what employees earn. Leanware’s dedicated teams start from about $6,000 a month for one full-time engineer. Staff augmentation can add one or two engineers.
What are the 5 levels of cost estimation?
A first-principles estimate from a written specification may fit Class 3 for budgeting if the scope is sufficiently defined; a preliminary specification may support only Classes 4 or 5. AACE classifies estimates by the maturity of their supporting information, so the estimating method alone does not determine the class.